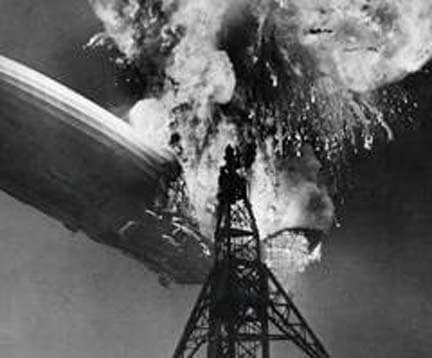
- High New Highs and New Lows: Both new 52-week highs and new 52-week lows must exceed a predetermined threshold, typically 2.8% of all traded issues on the exchange.
- Short-Term Uptrend: The broader market index must still be in an overall uptrend, usually verified by a positive 50-day Rate of Change or the index trading above its level from 50 trading days prior.
- Weakening Breadth Momentum: The McClellan Oscillator, a widely followed gauge of short-term breadth momentum, must register a negative reading.
- Cap on Highs: The number of new 52-week highs cannot exceed double the number of new 52-week lows.
While a single isolated signal can occur during choppy trading, technical analysts place the greatest emphasis on clusters—situations where two to three signals fire within a compressed window of 10 to 30 trading days.
Recent Warnings and Market Status
Technical analysts have pointed to recurring clusters of Hindenburg Omen signals as evidence of a persistent “split tape.”
Following an initial grouping, the indicator fired aggressively in February, producing three signals across just six trading sessions, followed by additional warnings. These triggers illustrated the stark divergence within the market: major indexes maintained elevated levels, but underlying participation remained fragmented, especially among smaller companies, interest-rate-sensitive equities, and listed debt instruments.
However, signals do not last indefinitely. By late September, several public technical trackers noted that the active cluster had cooled off into an inactive status, indicating that the immediate technical pressure had eased rather than escalating into a disorderly collapse.
Reliability and Key Limitations
The Hindenburg Omen gained legendary status because it successfully preceded several of modern finance’s worst downturns, including the 1987 “Black Monday” crash and the 2008 global financial crisis. Despite those high-profile successes, the indicator has notable limitations that warrant caution:
- A High False-Positive Rate: Historically, a single Hindenburg Omen signal leads to a full-blown crash less than 25% to 30% of the time. Even confirmed clusters—such as those observed in 2010, 2014, and late 2025—have frequently resulted in modest pullbacks or were bypassed altogether as the broader market continued to rally.
- Structural Distortions on Modern Exchanges: The composition of the NYSE has changed considerably since the indicator was conceived. Today, the exchange lists hundreds of non-operating financial products, including closed-end bond funds, preferred shares, and inverse exchange-traded funds. Because these instruments are heavily sensitive to interest rate fluctuations rather than corporate earnings or broad equity health, sudden shifts in yields can trigger a surge in 52-week lows that distorts the data and produces “false” Omens.
The Bottom Line
The Hindenburg Omen is best understood as a yellow caution flag for market breadth rather than an automated “sell everything” trigger. When it fires in clusters, it provides a valuable reminder that a calm index surface can sometimes conceal mounting internal stress. For prudent investors, the indicator is a cue to monitor market participation, scrutinize portfolio risk, and avoid complacency—not a guarantee of impending doom.